Ivanti Ticket Report Tool
Data visualisation and reporting tool to be used with Ivanti ticketing system
A simple Python Tkinter application for visualizing and analyzing ticket data from CSV files. The tool provides several output methods for quick insights and custom graphing, including ticket age analysis and owner activity over time.
Features
-
Custom Graph:
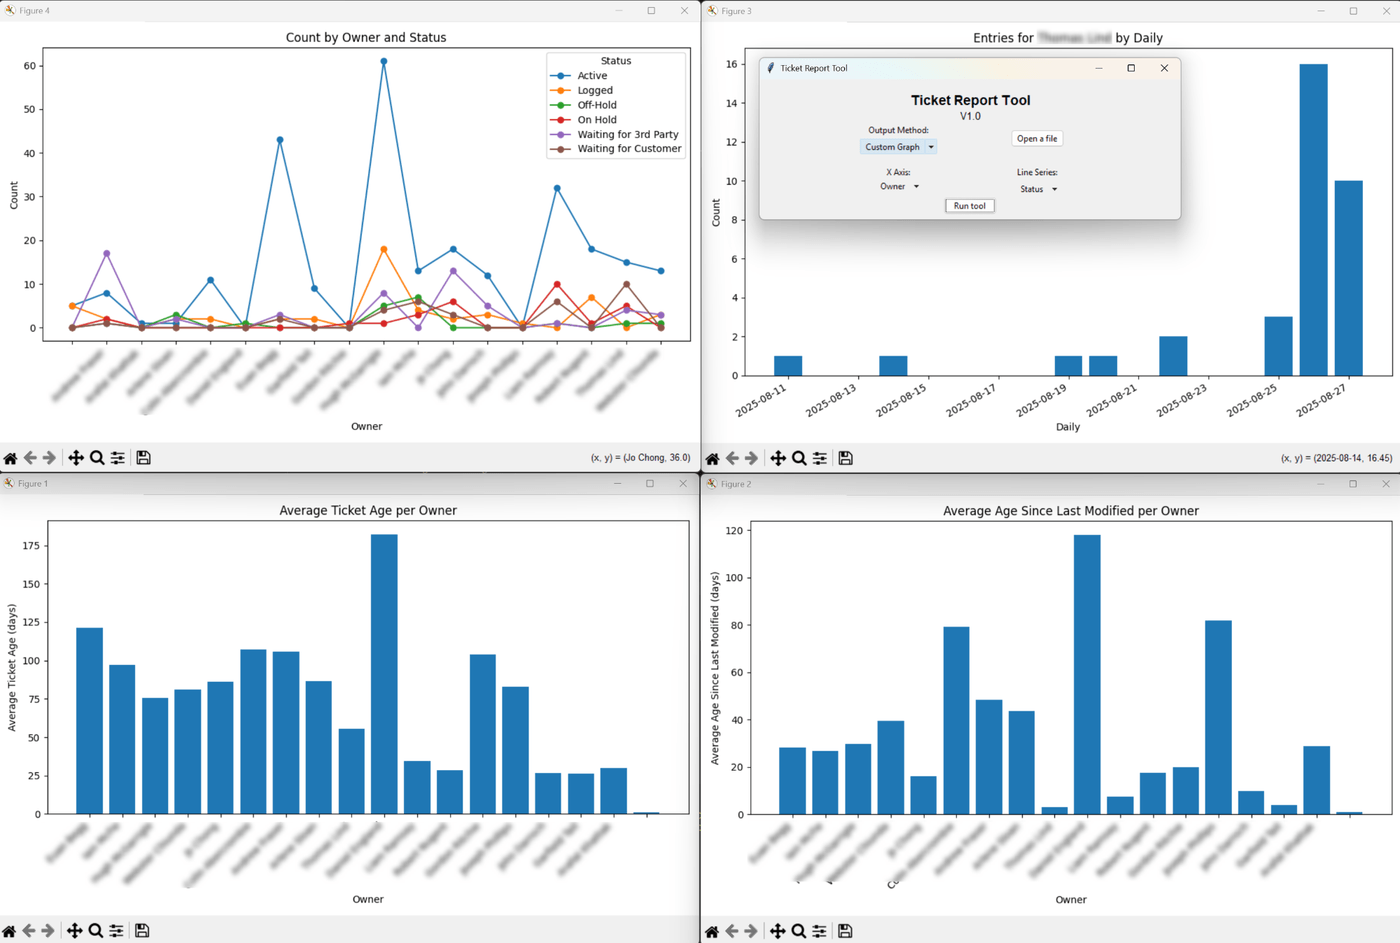
Plot counts of any column (e.g., Owner, Status, Category) with line series for another column. -
Average Ticket Age:
Bar chart of each owner and the average age (in days) of their tickets, based on the “Created On” date. -
Average Ticket Modified:
Bar chart of each owner and the average age (in days) since their tickets were last modified, based on the “Modified On” date. -
Owner Last Modified:
Select an owner and group their ticket modifications by day, week, or month, visualized as a bar chart. -
Export Oldest Tickets:
Generate a CSV of tickets older than, or modified before a specified date. This new CSV can then be input to visualise data.
Usage
-
Install requirements:
pip install matplotlib -
Run the tool:
python TicketReport.py -
Load your CSV file:
- Click “Open a file” and select your ticket CSV file.
- The CSV should have columns like
Owner,Created On,Modified On, etc.
-
Choose an output method:
- Use the “Output Method” dropdown to select the type of analysis or graph you want.
-
Configure options:
- For “Custom Graph”, select X Axis and Line Series columns.
- For “Owner Last Modified”, select an owner and date grouping (Daily, Weekly, Monthly).
-
Run the analysis:
- Click “Run tool” to generate the plot.
CSV Requirements
- The CSV must have a header row.
- For ticket age features, columns named
Owner,Created On, and/orModified Onare required. - Date columns must be in the format:
M/D/YYYY H:MM(e.g.,8/26/2025 14:48).
Example Columns
Incident, Status, Customer, Department, Summary, Description, Resolution, Service, Category, Subcategory, Team, Owner, Source, Created On, Modified On, Resolved On, ...Screenshots
License
MIT License
Developed for quick ticket data analysis and visualisation